
Your child brings home a beautifully drawn bar chart of how tall five bean plants grew. Ruler-straight bars, labelled axes, a title, the lot. Two weeks later they cannot answer a question about a graph printed in their science book, and everyone assumes the science is the problem.
It usually is not. Reading a science diagram or graph is a different skill from drawing one, and school spends far more time on the second than the first. Here is what children actually miss, and a short routine that fixes most of it.
The asymmetry nobody mentions
Look at what the curriculum asks for and the imbalance is visible in the verbs.
Pupils in Years 3 and 4 should be "gathering, recording, classifying and presenting data in a variety of ways to help in answering questions", and "recording findings using simple scientific language, drawings, labelled diagrams, keys, bar charts, and tables". By Years 5 and 6 it becomes "recording data and results of increasing complexity using scientific diagrams and labels, classification keys, tables, scatter graphs, bar and line graphs".
Gathering, recording, classifying, presenting. Every one of those is a producing verb.
Interpretation is in there too, and it is real: children should be "using results to draw simple conclusions, make predictions for new values, suggest improvements and raise further questions", and later they "look for different causal relationships in their data". But notice the possessive. It is their data, from their experiment, which they already understand because they were standing there when it happened.
The American framing sets the same expectation. In grades 3 to 5, students represent data in tables and graphical displays such as bar graphs, pictographs and pie charts "to reveal patterns that indicate relationships". Also a producing verb, with interpretation attached to the thing they made.
So a child arrives at a diagram they did not draw, about an experiment they did not run, and has to work backwards from a picture to a meaning. Nobody taught that, because it looks like the same skill.
Six things children miss
These come up again and again, roughly in order of how much damage they do.
1. They look at the picture and skip the labels
In a labelled diagram, almost all the information is in the labels and the lines pointing at things. The drawing is a hook to hang them on. A child who studies the shape of a heart and never reads the six labels has looked at an illustration rather than read a diagram.
2. They do not check what one step is worth
Each square might be one unit, or five, or a hundred. A child who assumes one gets the shape right and every number wrong, which is a particularly frustrating kind of error because the reasoning was sound.
3. They assume the axis starts at zero
It often does not, and a truncated scale makes a small difference look enormous. This is the single most common way a graph misleads an adult too. A child who has learned to glance at the bottom of the vertical axis before anything else has learned something they will use for life.
4. They treat the key as decoration
Two lines on one graph, or two colours of bar, mean the chart is answering a comparison rather than a single question. Children routinely read one line, ignore the other, and answer as though only one existed.
5. They think an arrow always means one thing
Arrows are the most overloaded symbol in science. In a water cycle diagram they mean movement. In a food chain they mean energy flows this way, which is the opposite of what most children assume they mean. In a forces diagram they mean a push or a pull, and their length matters. Children pick one meaning early and carry it everywhere.
6. They read a line graph as a picture of the event
This one is big enough that it needs its own section.
Not sure which level your child should start at? A free trial class with a Codeyoung teacher shows you exactly where they are and what they are ready for next, before you commit to anything.
Book a Free Trial →A line graph is not a picture of what happened
Show a child a graph of a cup of tea cooling and ask them to describe it. A surprising number will say something like "it goes down a slope" or "it is like a hill".
They are describing the shape on the paper. What the graph says is something else entirely: as time passes, the temperature falls, quickly at first and then more slowly. Those are two quantities in a relationship, and the line is a record of that relationship rather than a drawing of an event.
The classic demonstration of the confusion is a graph of a cyclist's journey. Distance on the vertical axis, time on the horizontal. When the line is flat, children very often say the cyclist is on flat ground. The flat line actually means the cyclist has stopped.
Once you have seen a child make that error you cannot unsee how common it is, and the fix is a single question, asked every time: what are the two things, and how does one change as the other changes? Not what does the line look like. What are the two things.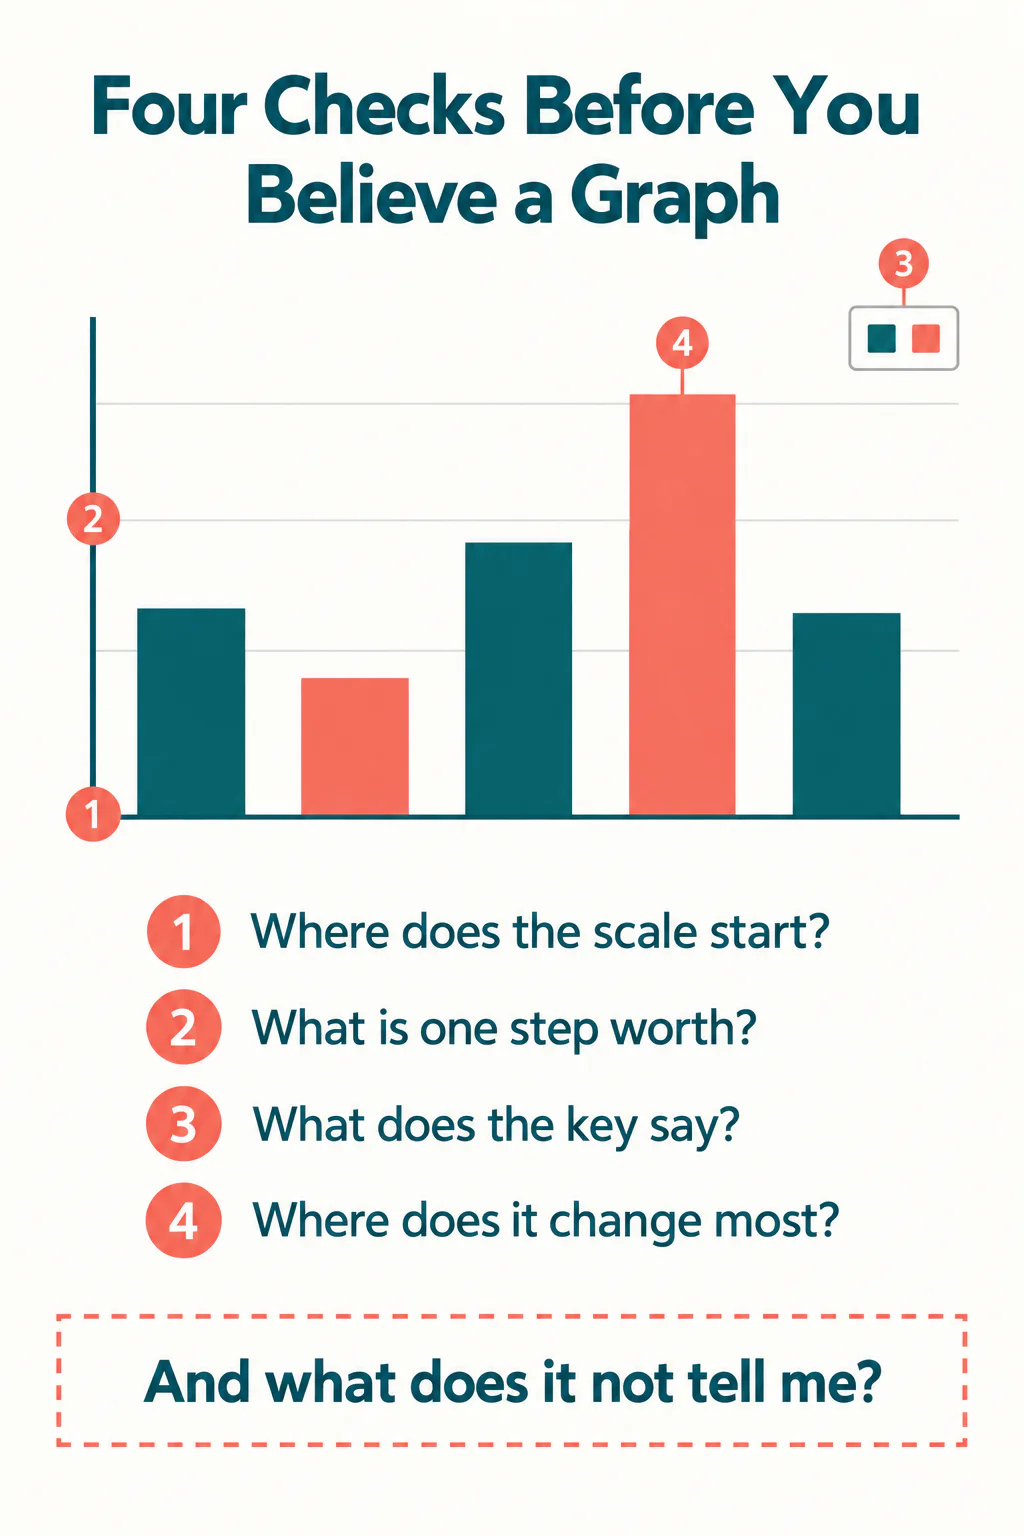
Four questions, in this order
This takes under a minute and works on any diagram, chart or graph a child meets.
- What are the two things? On a graph, name what is on each axis out loud, with its units. On a labelled diagram, read every label before looking at the drawing again.
- What is one step worth? One square, one gridline, one interval. And where does the scale start.
- Where does it change most, and where does it stay still? The steepest part and the flat part are where the science is. Everything else is the gap between them.
- What can I now say that I could not say before? One sentence. If they cannot produce one, they have looked at the graph rather than read it.
Question four is the one to insist on. It is also, not coincidentally, what the curriculum is asking for when it says pupils should use results to draw conclusions and look for causal relationships. A child who can finish that sentence has done the actual work.
And it is worth adding a fifth question once they are comfortable: what does this chart not tell me? A bar chart of five bean plants says nothing about the sixth, or about next month, or about why. Children who ask that question early become adults who are hard to mislead with a graph, which is a related habit we wrote about in teaching kids to question averages.
Where to practise without it feeling like school
The best practice material is already in your house and none of it looks like homework.
- The weather app. Two questions: when is the warmest part of tomorrow, and how much does it change overnight.
- A cereal box. Nutrition panels are tables, and reading a table is the same skill with the pictures removed.
- A map with a key. Contour lines are a line graph folded into two dimensions, and the key is doing real work.
- A newspaper chart. Particularly good for question three about where the axis starts, because the answer is often revealing.
- Their own experiment written up twice. Once as a table and once as a chart. Asking which one answers the question faster teaches more about graphs than either alone.
Two minutes is enough. The goal is not a lesson, it is the habit of checking the axes before believing the shape.
Why this shows up as a science problem
Because it costs marks in science and almost nowhere else, so that is where it gets noticed.
A child who can recite a process and still cannot read its diagram is in the same position as one who can pass a test without understanding the content, which we covered in why kids pass science tests without understanding science. The recall is intact and the representation is not connected to it.
The connection is repairable and it is repaired by handling other people's diagrams, out loud, with somebody asking the four questions until the child asks them unprompted. That is a small amount of work for something that keeps paying off through secondary science, geography and eventually any job that involves a dashboard. If your child is presenting their own results, helping with a science fair project without taking over covers the other side of the same coin. Because those are two different skills and school practises one of them far more. The curriculum's science requirements are full of verbs like gathering, recording and presenting data. Extracting information from somebody else's diagram is a separate ability that gets much less deliberate teaching time. The axes, and specifically what one step is worth on each. A child who has not noticed that the vertical scale starts at 40 rather than 0, or that each square is 5 units and not 1, will read the shape of the graph correctly and still get every number wrong. They read the line as a picture of an event rather than as a relationship between two quantities. A rising then falling line for a cooling experiment gets described as a hill, or as something going up a slope, instead of as one measurement changing as another one changes. Several different things, which is exactly the problem. An arrow can show direction of movement, the sequence of a process, a force, or energy transfer. Children usually settle on one meaning and apply it everywhere, so a water cycle diagram and a forces diagram get read the same way. It covers producing them in detail. Upper key stage 2 pupils record results using scientific diagrams and labels, classification keys, tables, scatter graphs, bar and line graphs. Interpretation appears too, but mostly aimed at data the child collected themselves rather than at a diagram in a book. Use graphs that already exist in your life: a weather app, a fitness tracker, a chart in a newspaper, the nutrition panel on a cereal box. Ask two questions rather than ten, and make one of them about what the chart does not tell you. Two minutes is genuinely enough.Frequently Asked Questions
Why can my child draw a bar chart but not answer questions about one?
What is the first thing to check on any science graph?
Why do children misread line graphs?
What do arrows mean in a science diagram?
Does the school curriculum cover reading graphs in science?
How can we practise this without it feeling like homework?
The short version
Children get a great deal of practice making diagrams and charts and very little reading ones they did not make. Those are separate skills, and the gap shows up as a science problem because science is where it costs marks.
The errors are consistent: skipping the labels, not checking what one step is worth, assuming the axis starts at zero, ignoring the key, and reading a line graph as a picture of an event rather than as two quantities in a relationship. Four questions catch nearly all of it, and the fourth one, what can I now say that I could not say before, is the one to insist on.
The expectations quoted above are in the national curriculum science programmes of study and in the NGSS practice of analysing and interpreting data. If diagrams are where your child's science keeps stalling, our online science classes for kids are 1:1, so a teacher can watch which of the six misreads is actually happening.
Codeyoung runs 1:1 live online classes for children aged 6 to 17, with a teacher who adapts the pace to your child rather than a fixed syllabus. The first class is free, so you can see how they respond before deciding.
Book a Free Trial