
The two people who invented the letter levels most American primary schools use have put this in writing: "Levels have no place in conferences, on report cards, or in discussions with a student." Irene Fountas and Gay Su Pinnell wrote that in 2019, and it sits awkwardly beside the report your child may have just brought home with a letter, or a number followed by an L, printed on it.
This guide to reading levels by grade covers the two systems you are most likely to meet, Lexile measures and Fountas and Pinnell guided reading levels, with the current figures for each grade, and then the part most charts skip: what the number on a school report can and cannot tell you. One finding up front. Many of the Lexile-by-grade charts parents find online reproduce an older MetaMetrics table, and the company's current norms, built from about 20 million students tested between 2021 and 2025, sit noticeably lower in the primary grades.
Key Takeaways
- A Lexile measure and a guided reading letter describe text difficulty and comprehension, not reading speed.
- MetaMetrics' current norms put the grade 5 winter median at 820L, about 100L below the midpoint of the older 770L to 1080L range still widely shared.
- The spread inside one grade is enormous: the middle 80 percent of fifth graders span 755 Lexile points in winter.
- Fountas and Pinnell say a level is "a teacher's tool" and not a child's label, and that it does not belong on a report card or a library shelf.
- The useful questions about any score are which test, which season, which percentile, and which direction it is moving.
Three different things get called a "reading level"
Parents are usually handed one of three numbers, and they measure different things.
- A Lexile reader measure, such as 640L, comes from a test. It places your child's reading comprehension on the same scale used to rate books.
- A Lexile text measure is the rating of a book, calculated from word frequency and sentence length. MetaMetrics is explicit that it refers to text difficulty only and does not address the content or quality of the book.
- A guided reading level, a letter from A to Z, is assigned by a teacher after listening to a child read, usually with the Fountas and Pinnell Benchmark Assessment System. It describes the books a child can read with teacher support in a small group.
None of these is fluency. Words correct per minute measures how quickly and accurately a child reads aloud, and it has its own norms, covered in our guide to reading fluency norms by grade. Speed and comprehension are related, but they come apart often enough that a child can be fast and still lost, which is the pattern described in reading fluently but missing the meaning. Everything below is about the difficulty of the text a child can understand.
Reading levels by grade: the age-banded table
Here are the current figures side by side. The Lexile columns are MetaMetrics' national student norms; the letter column is the grade-level goal range from the Fountas and Pinnell Text Level Gradient.
| Grade | Typical age | F&P goal range | Lexile median, fall | Lexile median, spring | Middle half, spring (25th to 75th) |
|---|---|---|---|---|---|
| K | 5 to 6 | A to D | BR315L | BR140L | BR345L to 60L |
| 1 | 6 to 7 | E to J | BR45L | 110L | BR90L to 310L |
| 2 | 7 to 8 | K to M | 200L | 335L | 135L to 540L |
| 3 | 8 to 9 | N to P | 415L | 535L | 335L to 735L |
| 4 | 9 to 10 | Q to S | 605L | 710L | 510L to 910L |
| 5 | 10 to 11 | T to V | 770L | 860L | 660L to 1055L |
| 6 | 11 to 12 | W to Y | 905L | 980L | 780L to 1175L |
| 7 | 12 to 13 | Z | 1015L | 1075L | 880L to 1270L |
| 8 | 13 to 14 | Z | 1105L | 1145L | 950L to 1335L |
| 9 | 14 to 15 | Z+ | 1160L | 1185L | 990L to 1380L |
| 10 | 15 to 16 | Z+ | 1195L | 1200L | 1010L to 1395L |
| 11 | 16 to 17 | Z+ | 1200L | 1190L | 1000L to 1380L |
| 12 | 17 to 18 | Z+ | 1180L | 1155L | 965L to 1340L |
Ages are the usual US ages for each grade; in England, a US grade 1 child is roughly in Year 2. Two things in this table surprise people. First, the medians stop climbing in high school and the grade 12 median actually falls from 1180L in the fall to 1155L in the spring. Second, Fountas and Pinnell give a single letter, Z, for grades 7 and 8 together and Z+ for high school and adult, because the gradient was built for the years when children are still learning to read.
Lexile measures by grade: what the current norms say
MetaMetrics publishes its norms as percentiles for fall, winter and spring of every grade from kindergarten to 12. A Lexile measure tells you where your child stands against a national sample, not whether they have reached a grade. The company is plain about this: "Lexile measures evaluate a student's individual reading ability rather than directly mapping to a specific grade level." Its older guidance put it more bluntly still: "There is no direct correspondence of a specific Lexile measure to a specific grade level."
The reason is the spread. In winter of grade 5, the 10th percentile reader sits at 440L and the 90th at 1195L, a gap of 755 Lexile points. That is wider than the distance between the grade 3 winter median (485L) and the grade 8 winter median (1125L). A fifth grade classroom genuinely contains readers working at what a chart would call third grade and readers working at what it would call ninth.
Two codes are worth knowing. BR means Beginning Reader, used for any measure below 0L, and the number after it counts how far below zero. So BR300L is an earlier stage than BR100L, the opposite of how the digits look. In the current norms the median kindergartner starts the year at BR315L, so BR on a kindergarten or grade 1 report is normal. MetaMetrics also suggests a comfortable range for choosing books of 100L below to 50L above a child's measure.
Why the Lexile chart you found may be out of date
Search for Lexile levels by grade and many of the tables that come back trace to an older MetaMetrics FAQ, still hosted on lexile.com, showing the middle 50 percent of readers at mid-year. The current norms, from the national sample of about 20 million students tested from 2021 to 2025, read differently, most sharply in the primary grades.
| Grade | Older table, mid-year, middle half | Current norms, winter, middle half | Current winter median |
|---|---|---|---|
| 3 | 415L to 760L | 285L to 685L | 485L |
| 5 | 770L to 1080L | 620L to 1020L | 820L |
| 8 | 985L to 1295L | 930L to 1320L | 1125L |
Take a grade 5 child who scores 760L in January. On the older table they fall below the bottom of the middle half, in the lowest quarter of fifth graders. On the current norms they sit comfortably inside the middle half, between the 25th percentile at 620L and the median at 820L. Same child, same score, and the verdict changes with the chart.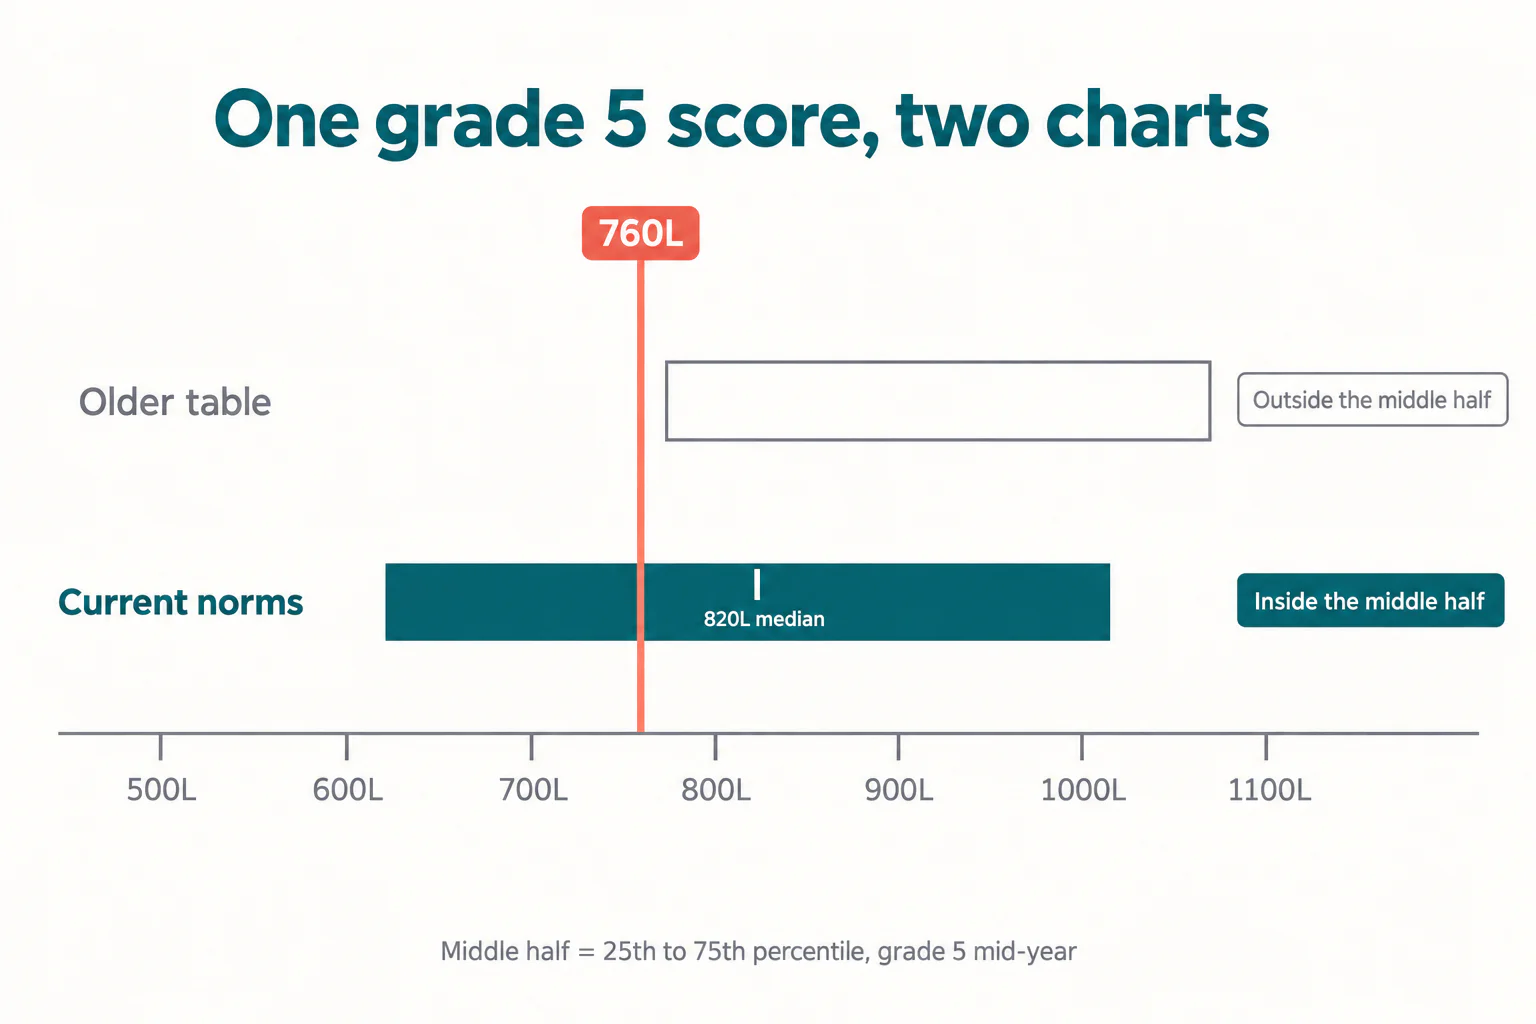
We are not claiming children read worse than they used to; the two tables come from different samples, and MetaMetrics does not publish a reason for the gap. The practical point is simpler. Before you compare a score to any chart, check whether the chart says which season it describes and when its sample was collected. If it does not, it is not worth comparing against.
Not sure what your child's reading score actually means for them? A free trial class with a Codeyoung English teacher shows you exactly where they are and what they are ready for next, before you commit to anything.
Book a Free Trial →The Common Core "stretch" bands: what texts are supposed to demand
Lexile norms describe readers. The Common Core text complexity bands describe texts, specifically how hard the reading material in each grade band should be. They were revised in 2012, in a supplement to Appendix A of the standards, to set what the document calls an upward trajectory so that students reach the college and career readiness level by the end of high school. That is why they are often called "stretch" bands.
| Common Core band | Text range (Lexile) | National median reader, spring of top grade |
|---|---|---|
| Grades 2 to 3 | 420L to 820L | 535L (grade 3) |
| Grades 4 to 5 | 740L to 1010L | 860L (grade 5) |
| Grades 6 to 8 | 925L to 1185L | 1145L (grade 8) |
| Grades 9 to 10 | 1050L to 1335L | 1200L (grade 10) |
| Grade 11 to college ready | 1185L to 1385L | 1155L (grade 12) |

Read the last row twice. The national median twelfth grader in spring, at 1155L, is below the bottom of the text band the standards set for the end of high school. This matches a caution MetaMetrics prints beside its own norms: a student at the 50th percentile "could be both at the mid-point of student norms and 'not meet grade-level performance standards'." Norms say where a child stands among peers. Standards, which states set, say where the system wants them to be. A school report may be quoting either, and the two are not interchangeable.
Guided reading levels A to Z, and what their creators say about them
The letter on many primary school reports comes from the F&P Text Level Gradient, which Fountas and Pinnell built to describe the demands of books using ten text characteristics, from A, the simplest, to Z. Their published grade-level goals run A to D in kindergarten, E to J in grade 1, K to M in grade 2, N to P in grade 3, Q to S in grade 4, T to V in grade 5, W to Y in grade 6, Z in grades 7 and 8, and Z+ for high school and adult. The chart itself carries the caveat that these goals "are intended to provide general guidelines, which should be adjusted based on school/district requirements and professional teacher judgement."
What the authors say about how levels should be used is the part rarely passed on to parents. In the 2019 article "Level Books, Not Children", published in the International Literacy Association's magazine Literacy Today, they write that of the five settings for reading they describe, only one, guided reading, uses leveled books. And then: "A level is a teacher's tool. It isn't a 'score,' and it certainly isn't a child's label."
In a 2017 interview with School Library Journal they went further: "It is our belief that levels have no place in classroom libraries, in school libraries, in public libraries, or on report cards." And on districts that restrict children to books at their level: "We would never take a book out of a child's hands." Instead, they suggest teachers tell families something like "your child is reading at a level that is about what we would hope for at this point in time in this grade", and show a book from the start of the year beside one from later on.
So if your school reports a letter, you have the creators' own backing to ask for the plain-language version instead, and to ignore any rule that limits your child's library choices to one colour-coded basket.
How to read the number on a school report
Whatever the report shows, four questions turn it from a label into information.
- Which test produced it, and in which season? A fall score and a spring score in the same grade differ by around 100L in grades 3 to 5 at the median. Compare fall with fall. MetaMetrics also acknowledges that tests taken within 30 days of each other sometimes show unexpectedly different results, so one score is an estimate.
- Is it a norm or a standard? "Below grade level" might mean below a state performance cut, or below a national median. Ask which. A child at the 40th percentile nationally is in the middle of the pack, whatever the colour on the report.
- What percentile is that? For a Lexile measure, the current MetaMetrics table answers this in a minute. For a letter level, ask whether it is about where the teacher would hope for this point in the year, which is the wording Fountas and Pinnell themselves recommend.
- Which direction is it moving? Two or three reports in a row tell you far more than any single one. A child growing steadily from a low start is in a better position than one stuck near the median.

What a reading level does not tell you
A Lexile text measure is calculated from two things, word frequency and sentence length. It cannot see whether a book's content suits a nine-year-old. MetaMetrics' own guidance warns that a strong reader "may not have the background knowledge or maturity to understand material written for an older audience", and that motivated readers often manage harder text on a topic they care about. Both point the same way: the number is a starting point for choosing books, not a fence around them.
A level also says nothing about why a child is where they are. A low score from a child who decodes slowly is a different problem from a low score in a child who reads every word correctly and retains nothing, and the first is often a phonics and decoding question. For practical comprehension work at home, our list of reading strategies for students of all grades is a sensible next step.
Reading levels by grade, in short
The honest summary of reading levels by grade is that the ranges are wide, the charts move, and the people who built the systems want them used carefully. MetaMetrics' current norms put the grade 5 winter median at 820L, lower than the older chart many parents meet, with a 755-point spread across the middle 80 percent. Fountas and Pinnell's letters were made for teachers choosing books for a small group, and they say plainly that a level does not belong on a report card or a library shelf.
When a number does arrive, check the test, the season and the percentile, then watch the trend across the year. If it is flat or slipping, 1:1 English classes can work on the comprehension underneath the score rather than the score itself.
Codeyoung runs 1:1 live online classes for children aged 6 to 17, with a teacher who adapts the pace to your child rather than a fixed syllabus. The first class is free, so you can see how they respond before deciding.
Book a Free TrialSources checked 12 November 2026: MetaMetrics Lexile Grade Level Charts (national norms, about 20 million students, 2021 to 2025) and the Lexile Hub educator and FAQ pages; MetaMetrics, "Lexile Measures and Grade Levels" FAQ (older mid-year table, on lexile.com); Supplemental Information for Appendix A of the Common Core State Standards: New Research on Text Complexity (Figure 1, text complexity bands); the F&P Text Level Gradient chart on fountasandpinnell.com; Fountas and Pinnell, "Level Books, Not Children", Literacy Today, January/February 2019; and Fountas and Pinnell's 2017 interview with School Library Journal. The older-versus-current Lexile comparison and the band-versus-median comparison are our own, read from the published tables.