
A teacher tells you your eight-year-old reads 75 words a minute. Depending on which chart that teacher opened, the same number makes your child slightly above average or eight words short of it. Both charts are real, both are published under the same two researchers' names, and the difference between them is eleven years of data. Reading fluency norms are useful, but almost every version circulating online has been quietly blended into something the researchers never published.
Here is the current table in full, the threshold that actually marks a child as needing help, and the three ways a home measurement goes wrong before you even look it up.
What are reading fluency norms?
They are benchmark tables showing how many words correct per minute children read aloud at each grade and each point in the school year, broken into percentiles. The measure is WCPM: total words read aloud in one minute, minus errors.
The standard reference is the Hasbrouck and Tindal compiled oral reading fluency norms, updated in 2017. The tables report the 10th, 25th, 50th, 75th and 90th percentiles for autumn, winter and spring. One structural detail matters immediately: there is no autumn row for grade 1, because most children at that point cannot yet read connected text reliably enough to time. If your child is in the first term of grade 1, there is no benchmark to compare them against, and a number taken now has nothing to be measured by.
The 2017 norms, grade by grade
These are the 50th percentile figures, which is what people mean by "average", alongside the 25th percentile so you can see how wide the normal spread is.
| Grade | Autumn 50th | Winter 50th | Spring 50th | Spring 25th | Avg gain per week at the 50th |
|---|---|---|---|---|---|
| 1 | no data | 29 | 60 | 34 | 1.9 |
| 2 | 50 | 84 | 100 | 72 | 1.6 |
| 3 | 83 | 97 | 112 | 91 | 0.9 |
| 4 | 94 | 120 | 133 | 105 | 1.2 |
| 5 | 121 | 133 | 146 | 119 | 0.8 |
| 6 | 132 | 145 | 146 | 122 | 0.3 |
All figures are words correct per minute from the 2017 Hasbrouck and Tindal tables. Look at the spring column and the spring 25th percentile together: in grade 4, the gap between a child at the median and a child at the 25th percentile is 28 words a minute. That is the ordinary range inside a single classroom, not a warning sign.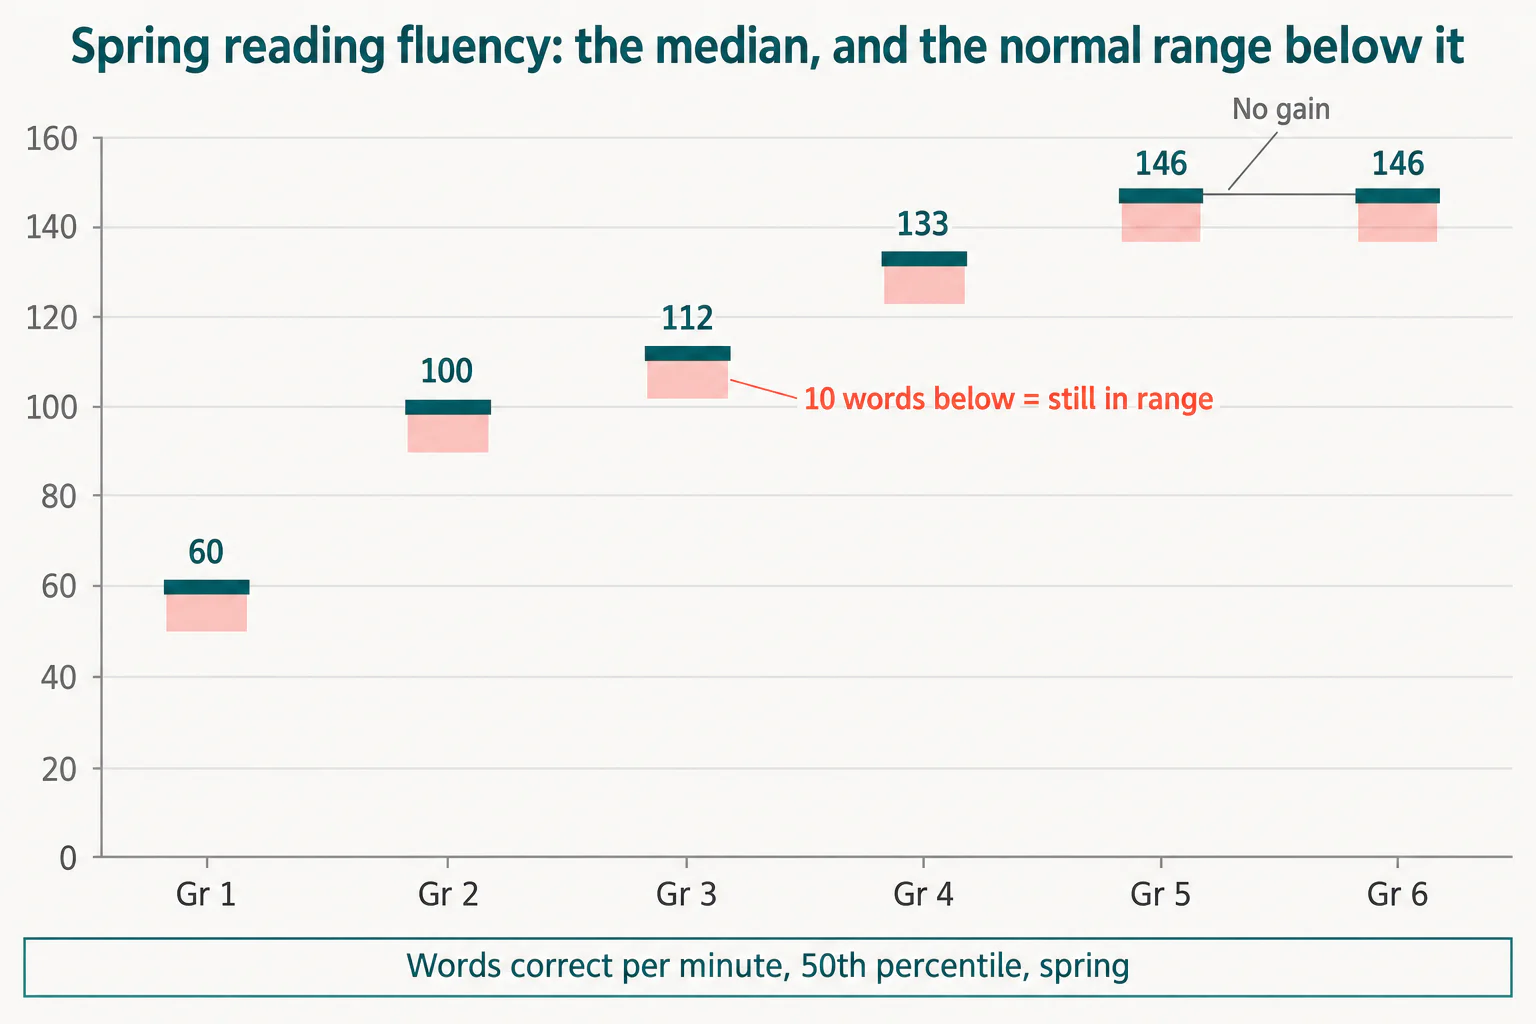
What actually counts as behind?
A gap of 10 or more words correct per minute below the 50th percentile for the child's grade and season. That is the published threshold for putting a child into a fluency-building programme, and it is the number almost no parent is given.
The distinction is not pedantry, because half of all children are below the median by construction. That is what a median is. A chart that marks everything under the 50th percentile as a problem has defined half the population as struggling, which is useless as a signal and corrosive as a message to a seven-year-old.
Work the example through. A grade 3 child reading 75 WCPM in the autumn sits 8 words below the 2017 median of 83. Below average, and inside the tolerance. No programme indicated on this measure. The honest thing to tell that family is that their child is in the normal range and the number is not the thing to act on.
Not sure which level your child should start at? A free trial class with a Codeyoung teacher shows you exactly where they are and what they are ready for next, before you commit to anything.
Book a Free Trial →Why the chart you found online is probably wrong
Two different datasets are being served as one. The 2017 update covers grades 1 to 6. The older 2006 tables cover grades 1 to 8. Any grade 7 or grade 8 figure presented as 2017 data has come from the 2006 study, and a surprising number of pages show a grades 1 to 8 table under a single 2017 heading.
The two sets also disagree, most sharply in the early grades, and always in the same direction.
| Grade and season, 50th percentile | 2006 norms | 2017 norms | Difference |
|---|---|---|---|
| Grade 1, spring | 53 | 60 | +7 |
| Grade 2, spring | 89 | 100 | +11 |
| Grade 3, autumn | 71 | 83 | +12 |
| Grade 4, autumn | 94 | 94 | no change |
| Grade 5, spring | 139 | 146 | +7 |
Now take that grade 3 child reading 75 words a minute in the autumn again. Against the 2006 median of 71, they are 4 words above average. Against the current median of 83, they are 8 words below it. One child, one reading, two opposite descriptions, and the only variable is which chart somebody printed.
So the first question to ask about any fluency number is not what it means. It is which table it was compared against, and whether the season matches.
Fluency stops growing earlier than parents expect
Read down the final column of the main table. Average weekly gain at the median runs at 1.9 words a minute in grade 1 and 1.6 in grade 2, then falls to 0.9, 1.2, 0.8, and finally 0.3 words a minute per week in grade 6.
The spring medians make the same point more bluntly: grade 5 finishes at 146 words a minute and grade 6 finishes at 146 words a minute. Identical. At the 10th percentile the grade 6 spring figure is actually lower than the grade 5 one, 91 against 102.
Fluency is a skill that is largely finished developing by the end of upper primary. After that, growth in reading shows up as vocabulary, background knowledge and comprehension instead, which is why a child can get faster at reading aloud and no better at understanding what they read. That failure pattern has its own diagnosis, and we cover it in reading fluently but missing the meaning.
The practical consequence: a parent timing a grade 6 child and hoping to see the number climb week by week is watching a measure that the norms themselves say has nearly stopped moving. Nothing is wrong. The measure has simply run out of road.
How to take a reading that is worth looking up
Use the average of two unpracticed readings from material at the child's grade level. Every word in that sentence is doing work, and most home measurements break at least one of them.
- Two readings, averaged. A single one-minute sample swings widely with the passage and the child's mood. One number is not a measurement.
- Unpracticed. The passage must be new. Timing a bedtime favourite measures memory, and it will flatter the score by a wide margin.
- Grade level, not reading level. The norms are built on grade-level text. Timing an easier book and looking the result up against the grade row compares two different things.
- Count errors honestly. Mispronunciations, substitutions and omissions are errors. Self-corrections and repetitions are not.
- Match the season. Autumn against autumn. Using the spring row in October will make almost any child look behind.

What a low number does not mean
A fluency score is one narrow measurement, and it is silent on most of what matters. It says nothing about whether a child understands what they read, which is measured by asking them to retell it. It says nothing about vocabulary or background knowledge. And a slow reader who decodes accurately has a different problem from one who guesses at words, which is a phonics and decoding question rather than a practice-volume one.
Two things genuinely do warrant attention. A gap of more than 10 words below the median that does not close over a term is worth raising with the school, because the shape of the trend matters more than any single reading. And a child who reads accurately but far below the norm while also failing to retell what they read has two issues stacked, not one, and the comprehension side is the more urgent of them. The equivalent judgement in maths follows the same logic, which we set out in is my child behind in maths.
If the number is inside the tolerance and the trend is flat but not widening, the correct response is to carry on reading together and stop timing.
What to take from this
The reading fluency norms answer a narrower question than parents are usually told. The current table covers grades 1 to 6, has no autumn figure for grade 1 at all, and sets the line for intervention at 10 or more words below the median rather than at the median itself. Below average is not behind. A grade 3 child at 75 words a minute in October is inside the normal range, and the same child looks above average on a chart that is now two decades old.
Measure properly or not at all: two fresh passages at grade level, averaged, compared against the matching season. Then watch the trend across a term rather than the number on any one afternoon. If the gap is widening, that is the signal worth acting on, and 1:1 English classes can work on the decoding accuracy underneath it rather than on speed for its own sake.
Codeyoung runs 1:1 live online classes for children aged 6 to 17, with a teacher who adapts the pace to your child rather than a fixed syllabus. The first class is free, so you can see how they respond before deciding.
Book a Free TrialSources: Hasbrouck and Tindal compiled oral reading fluency norms, 2017 and 2006 tables. All figures read from the published tables and checked 27 October 2026. The 2006 against 2017 comparison is our own, computed from the two published tables.